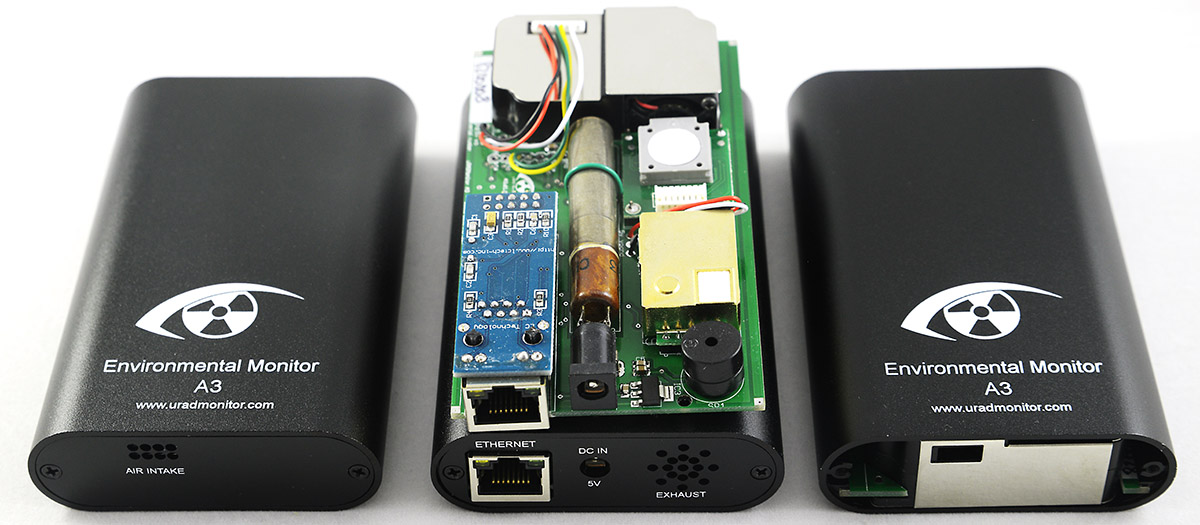
uRADMonitor Model A3 is a fixed monitoring station designed to measure a total of 8 important parameters related to pollution and air quality, continuing the environmental monitoring direction that was introduced by the Model D. It was first announced in June 2016, initially being deployed in public transportation, marking our company’s first steps towards the #smartcity sector. The current third hardware iteration comes in a rugged aluminium enclosure with wall mounting support and four connectivity options including one by cable (Ethernet) and three wireless solutions based on WiFi (802.11b/g/n), GSM (2G/3G) and LoRAWAN.
Sensors
uRADMonitor model A3 uses the BME680 from Bosch to measure air temperature, barometric pressure, humidity and volatile organic compounds, or VOC. A high quality laser scattering sensor is used to detect the Particulate Matter PM2.5 concentration in air. There is an electrochemical formaldehyde sensor, a nondispersive infrared sensor to measure CO2 concentration in air and a SI29BG Geiger Tube to detect gamma and x-ray ionising radiation. A built in fan assures an active air flow stream across the sensing elements.
| Sensor | Parameter | Minimum value | Maximum value |
| Bosch BME680 | Temperature | -40 °C | +85 °C |
| Pressure | 300 hPa | 1100 hPa | |
| Humidity | 0% RH | 100% RH | |
| VOC | 0 mg/m³ | 100 mg/m³ reducers 10 mg/m³ oxidizers |
|
| Winsen ZH03A | PM2.5 | 0 μg/m³ | 1000 μg/m³ |
| Winsen ZE08 | Formaldehyde | 0 ppm | 5 ppm |
| Winsen MH-Z19B | Carbon Dioxide | 400 ppm | 5000 ppm |
| SI29BG * | γ,x-rays | 0.01μSv/h | 9999.99μSv/h |
* Each Model A3 dosimeter is subjected to a final test: the tested device must be in a confidence interval of 5% in comparison to a master. This master is adjusted to a gauged reference Cs-137 emitter.
Health impact
Many of the pollutants measured by Model A3 can have a negative impact on our health, ranging from simple allergies to various cancers. It is therefore imperative to know our environment if we intend to preserve our health. This is not just about a neighbourhood or city, it goes up to global scale thanks to the interconnected network of detectors we are building. The uRADMonitor network generates the big picture on pollution presenting it as a phenomenon. This way we stand a better chance of taking more efficient early measures against the root cause itself.

VOC or volatile organic compounds, are a class of substances that evaporate at room temperature. Being different substances, may be responsible for a broad category of disorders, including respiratory problems, allergic or weakening immunity in children. Some VOC ‘s are responsible for the formation of smog, irritation of eyes, nose and throat, headaches and concentration problems. In extreme circumstances, more severe complications can occur, such as damage to liver, kidney and central nervous system or cancer [1].
Ionizing radiation is harmful to living organisms because it can cause damage to cells that can result in multiple disorders , the most common of which is cancer. Ionizing radiation is naturally occurring from cosmic and terrestrial sources, but there are also artificial generators related to nuclear activities or x-ray devices . Worldwide global average dose is 3.01mSv [2].
Particulate matter PM2.5 refers to small particles with a diameter of up to 2.5 microns. These particles can penetrate deep into the lungs , causing allergies, respiratory and cardiovascular diseases .[3]
Formaldehyde is a toxic colorless gas with a pungent smell, that results from the burning of carbon based materials. It can be found in forest fires, in automobile exhaust and cigarette smoke. It is an allergenic and a known carcinogenic compound that can cause serious health effects, depending on concentration and exposure. Even in tiny quantities just above 0.1ppm it can irritate the eyes and nose, and can worsen asthma symptoms [4].
Carbon dioxide is a gas heavier than air. In small quantities of up to 5000ppm (0.5% ) can cause headaches, lethargy, slowing of intellectual ability, irritability, sleep disturbance. In larger quantities can cause dizziness, loss of sight, hearing or knowledge. The fresh air contains between 360ppm and 410 ppm of CO2. [5]
[1] Volatile Organic Compounds’ Impact on Indoor Air Quality, US Environmental Protection Agency
[2] Radiation Health Effects, US Environmental Protection Agency
[3] Health and Environmental Effects of Particulate Matter (PM), US Environmental Protection Agency
[4] ToxFAQs™ for Formaldehyde, Agency for Toxic Substances and Disease Registry
[5] Health Risk Evaluation for Carbon Dioxide, US Bureau of land management
Product features
The model A3 is designed as a fixed monitoring station. It comes in 4 variants, with the same sensors but offering different connectivity options: Ethernet, Wifi, GSM/GPRS and LoraWAN. It takes any voltage in the 6V – 28V interval and uses about 1 Watt of power to run. A built in speaker can provide audible notifications, configurable via the dashboard. This unit doesn’t have a screen, it works as a monitor and the data can be viewed remotely on a computer or on a mobile device.

| Item | Parameter | Ratings |
| Voltage | External | 6V – 28V |
| Connectivity | 4 options | Ethernet, WiFi, GSM, LoRaWAN |
| Microcontroller | Atmega328p | 8 bit |
| Enclosure | Rugged aluminium | 110x80x24 mm |
Getting your own detector
The uRADMonitor project relies on civic attitude at a global level, being supported by a large number of individuals. By purchasing a detector today, you get a high quality dosimeter and at the same time contribute data to this worldwide initiative, supporting the project’s development. To get your unit, click here.


When can we get the WiFi version and how much would it cost?
I would like to add another one in Bucharest.
I am interested in changing the MH-Z19B co2 measurement range from 2000ppm to 5000ppm. Have you done this and can you share your code?
We done that in the factory, as part of the MH-Z19B firmware install & config, but I recall the datasheet showing the commands for this as well. You’ll only need a simple USB2UART adapter and a terminal.
This is an old post, but I was just curious how the fan works for the monitor in relation to the pressure sensor? Did you notice any effects on the pressure reading from the BME sensor while running the fan?
I’ve debated about using a small fan for some of my little outdoor projects, never actually tested but I assumed that if I continuously ran the fan then it would have some influence on the pressure reading. Probably would be fine if I just read the value right after cutting the fan off (as long as the enclosure is open to atm of course).
This is an excellent question. I’ve seen a few pressure fluctuations on the A3 units installed on buses here: http://www.uradmonitor.com/cluj , correlated to the autovehicle speed.
But nothing related to the fan, the air flux is low, just to sample some of the exterior air.