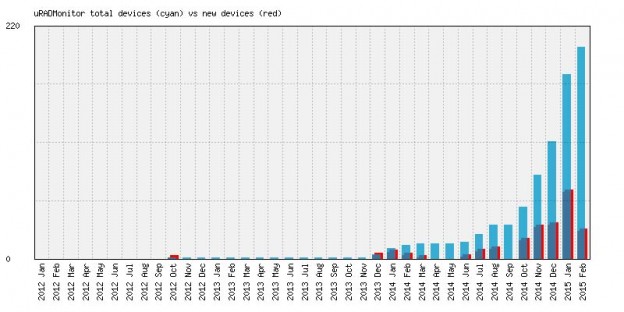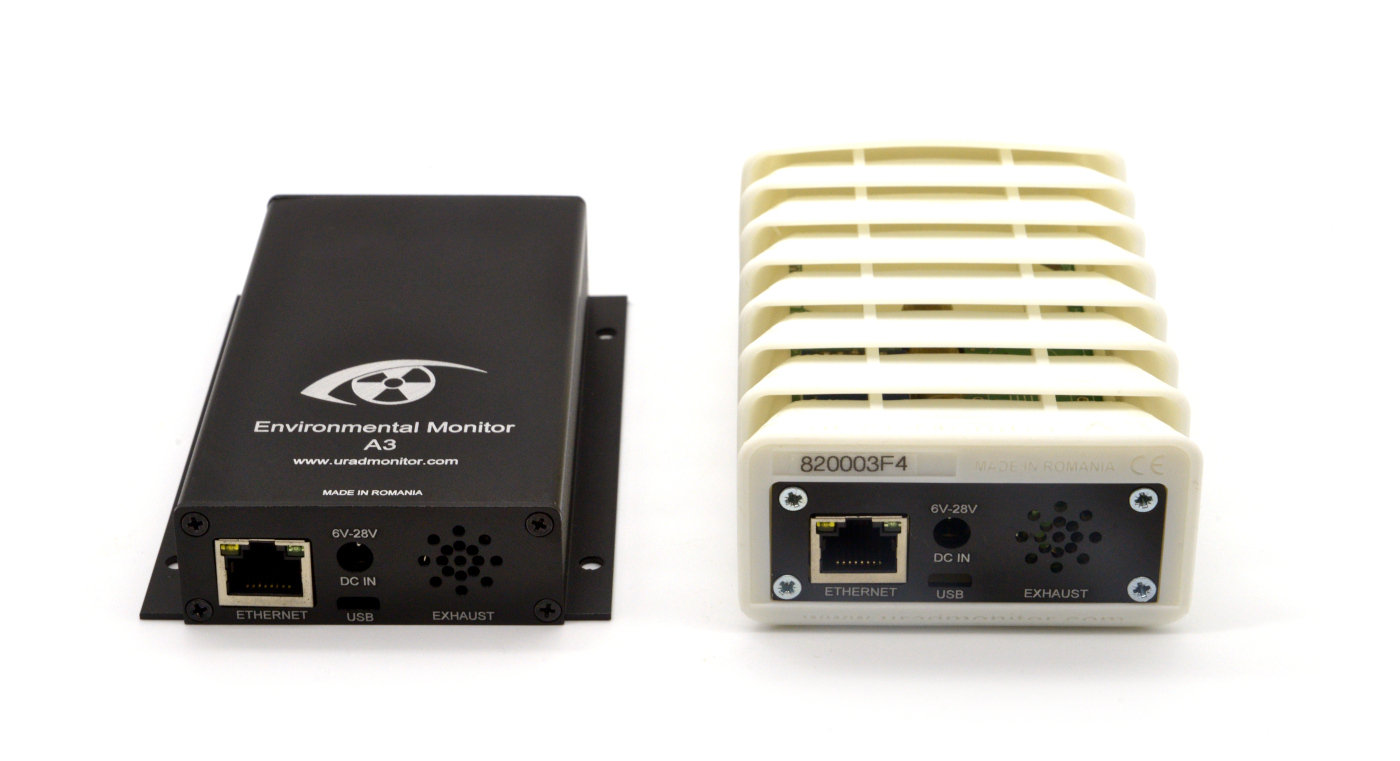
Not long after the 2014 summary announced a first achievement of 100 units deployed globally, the network has already doubled its size, with a total of two hundred units installed or in transit to their new location.

The new locations are many and it would be a rather complicated task to name them all in a decent size blog post, but iterate just a few, the additions include:


With this impressive increase in units reaching two hundred, the volume of global radiation data collected has gone up as well, getting closer to a total of 20 million entries.

The stats show a major presence of uRADMonitor units in the United States, followed by Australia, Germany, Canada and Great Britain. The column marked TMP represents mostly units currently in transit or waiting to be installed.

Join now to contribute to this community global radiation monitoring project and help the network expand even further!


That is awesome.
Lets do 1000 units online this year. 🙂
how can i get monitors?
These statistics are interesting. If we look at the numbers installed per million population for each country for the first few we get:
AU 0.64
DE 0.13
US 0.13
UK 0.14
CA 0.25
NL 0.47
RO 0.35
CH 0.004
FR 0.09
NO 1.2
NZ 0.87
I can understand the higher installed base for Europe but why are AU & NZ the 3rd and 2nd respectively on this basis? These are countries with no nuclear power generation and in AU only one small research/medical/industry reactor. As far as I’m aware there are no reactors in NZ?
John (from AU)
Hi John, that is a very interesting analysis. I can’t really think of a reasonable explanation for this distribution, but there’s clearly some increased awareness for nuclear technologies in these segments of the population.
Even with no reactors, contaminated particles can still travel – though there are certain limitations on the distance, based on the altitude they reach.
I would attribute the increased interest in AU/NZ to EEVblog and Fukushima.